Streaming Metrics to Chainflip
Node operators often fear the prospect of being slashed, which is a prevalent issue. The causes can vary widely, from network disruptions to a lack of available disk space to running on under-resourced machines.
To assist Chainflip in understanding why your node is experiencing slashing, streaming your node metrics would be highly advantageous. Chainflip asks that you install process-exporter (opens in a new tab) and node-exporter (opens in a new tab) on your machines, so that we can scrape metrics using Prometheus (opens in a new tab).
Overview
The setup consists of the following components:
- Install Node Exporter and Process Exporter.
- Add configuration files.
- Update your
chainflip-nodesystemdfile to expose substrate prometheus metrics. - Ensure that ports on your node are exposed to allow our Prometheus instance to access and scrape your metrics.
Install Node Exporter
Download Node Exporter Binary
cd /tmp
wget https://github.com/prometheus/node_exporter/releases/download/v1.5.0/node_exporter-1.5.0.linux-amd64.tar.gz
Create node_exporter User
sudo groupadd -f node_exporter
sudo useradd -g node_exporter --no-create-home --shell /bin/false node_exporter
sudo mkdir -p /etc/node_exporter
sudo chown node_exporter:node_exporter /etc/node_exporter
Unpack and Install Node Exporter Binary
tar -xvf node_exporter-1.5.0.linux-amd64.tar.gz
mv node_exporter-1.5.0.linux-amd64 node_exporter-files

sudo cp node_exporter-files/node_exporter /usr/local/bin/
sudo chown node_exporter:node_exporter /usr/local/bin/node_exporter

# Clean Up
rm -rf node_exporter-1.5.0.linux-amd64.tar.gz node_exporter-files
Setup Node Exporter Service
Run the following command to create a service file:
sudo nano /etc/systemd/system/node_exporter.serviceThen copy and paste the following into the service file:
[Unit]
Description=Node Exporter
Documentation=https://prometheus.io/docs/guides/node-exporter/
Wants=network-online.target
After=network-online.target

[Service]
User=node_exporter
Group=node_exporter
Type=simple
ExecStart=/usr/local/bin/node_exporter --web.listen-address=:9100

[Install]
WantedBy=multi-user.target
Save and exit (CTRL+x then hit y then hit Enter)
Change the file permissions:
sudo chmod 664 /etc/systemd/system/node_exporter.serviceReload systemd and start the Node Exporter Service
sudo systemctl daemon-reload
sudo systemctl start node_exporter
sudo systemctl enable node_exporter
Make sure your firewall exposes port 9100 publicly.
Check the Whole Setup
Check the status of Node Exporter
sudo systemctl status node_exporterYou should see something like the following:
.png)
Check whether Metrics are accessible
You can also verify that your node is exposing metrics by navigating to this url in a web browser:
http://<your_node_public_ip_address>:9100/metricsYou should see the raw metrics that the node exporter exposes:
.png)
If you aren't able to access the metrics, double check your firewall settings
and make sure port 9100 is exposed and publicly accessible.
Install Process Exporter
Setting up Process Exporter is a similar process as in the previous section.
The following commands are similar to the ones in the previous section but they are not the same. make sure to execute them in order.
Download Process Exporter Binary
cd /tmp
wget https://github.com/ncabatoff/process-exporter/releases/download/v0.7.10/process-exporter-0.7.10.linux-amd64.tar.gz
Create process_exporter User
sudo groupadd -f process_exporter
sudo useradd -g process_exporter --no-create-home --shell /bin/false process_exporter
sudo mkdir /etc/process_exporter
sudo chown process_exporter:process_exporter /etc/process_exporter
Unpack and Install Process Exporter Binary
tar -xvf process-exporter-0.7.10.linux-amd64.tar.gz
mv process-exporter-0.7.10.linux-amd64 process_exporter-files

sudo cp process_exporter-files/process-exporter /usr/local/bin/process_exporter
sudo chown process_exporter:process_exporter /usr/local/bin/process_exporter

# Clean Up
rm -rf process-exporter-0.7.10.linux-amd64.tar.gz process_exporter-files
Create Process Exporter Config File
sudo nano /etc/process_exporter/process-exporter.yamlThen copy and paste the following into the file:
process_names:
  - comm:
      - chainflip-node
      - chainflip-engine*
Setup Process Exporter Service
Run the following command to create a service file:
sudo nano /etc/systemd/system/process_exporter.serviceThen copy and paste the following into the service file:
[Unit]
Description=Process Exporter for Prometheus
Documentation=https://github.com/ncabatoff/process-exporter
Wants=network-online.target
After=network-online.target

[Service]
User=process_exporter
Group=process_exporter
Type=simple
Restart=on-failure
ExecStart=/usr/local/bin/process_exporter \
  --config.path /etc/process_exporter/process-exporter.yaml \
  --web.listen-address=:9256

[Install]
WantedBy=multi-user.target
Save and exit (CTRL+x then hit y then hit Enter)
Change the file permissions:
sudo chmod 664 /etc/systemd/system/process_exporter.serviceReload systemd and start the Node Exporter Service
sudo systemctl daemon-reload
sudo systemctl start process_exporter
sudo systemctl enable process_exporter.service
Make sure your firewall exposes port 9256 publically.
Check the Whole Setup
Check the status of Process Exporter
sudo systemctl status process_exporterYou should see something like the following:
.png)
Check whether Metrics are accessible
You can also verify that your node is exposing metrics by navigating to in a web browser:
http://<your_node_public_ip_address>:9256/metricsYou should see the raw metrics that the process exporter exposes:
If you aren't able to access the metrics, double check your firewall settings
and make sure port 9256 is exposed and publically accessible.
Expose Prometheus metrics for chainflip-node
chainflip-node is built using substrate (opens in a new tab) which uses Prometheus natively to expose metrics.
To make those metrics available you will have to override the default systemd file that ships with the package. To do so run the following:
sudo mkdir -p /etc/systemd/system/chainflip-node.service.d/
cat <<EOF | sudo tee /etc/systemd/system/chainflip-node.service.d/override.conf >/dev/null
[Service]
ExecStart=
ExecStart=/usr/bin/chainflip-node \
  --chain /etc/chainflip/perseverance.chainspec.json \
  --base-path /etc/chainflip/chaindata \
  --node-key-file /etc/chainflip/keys/node_key_file \
  --validator \
  --prometheus-external
EOF
sudo systemctl daemon-reload
sudo systemctl restart chainflip-node.service
Notice the --prometheus-external flag we added to instruct the node
binary to expose the metrics. These are not exposed by default.
If you want to learn more about systemd overrides, please refer to this page:
Make sure your firewall exposes port 9615 publicly.
Check whether Metrics are accessible
You can also verify that your node is exposing metrics by navigating to in a web browser:
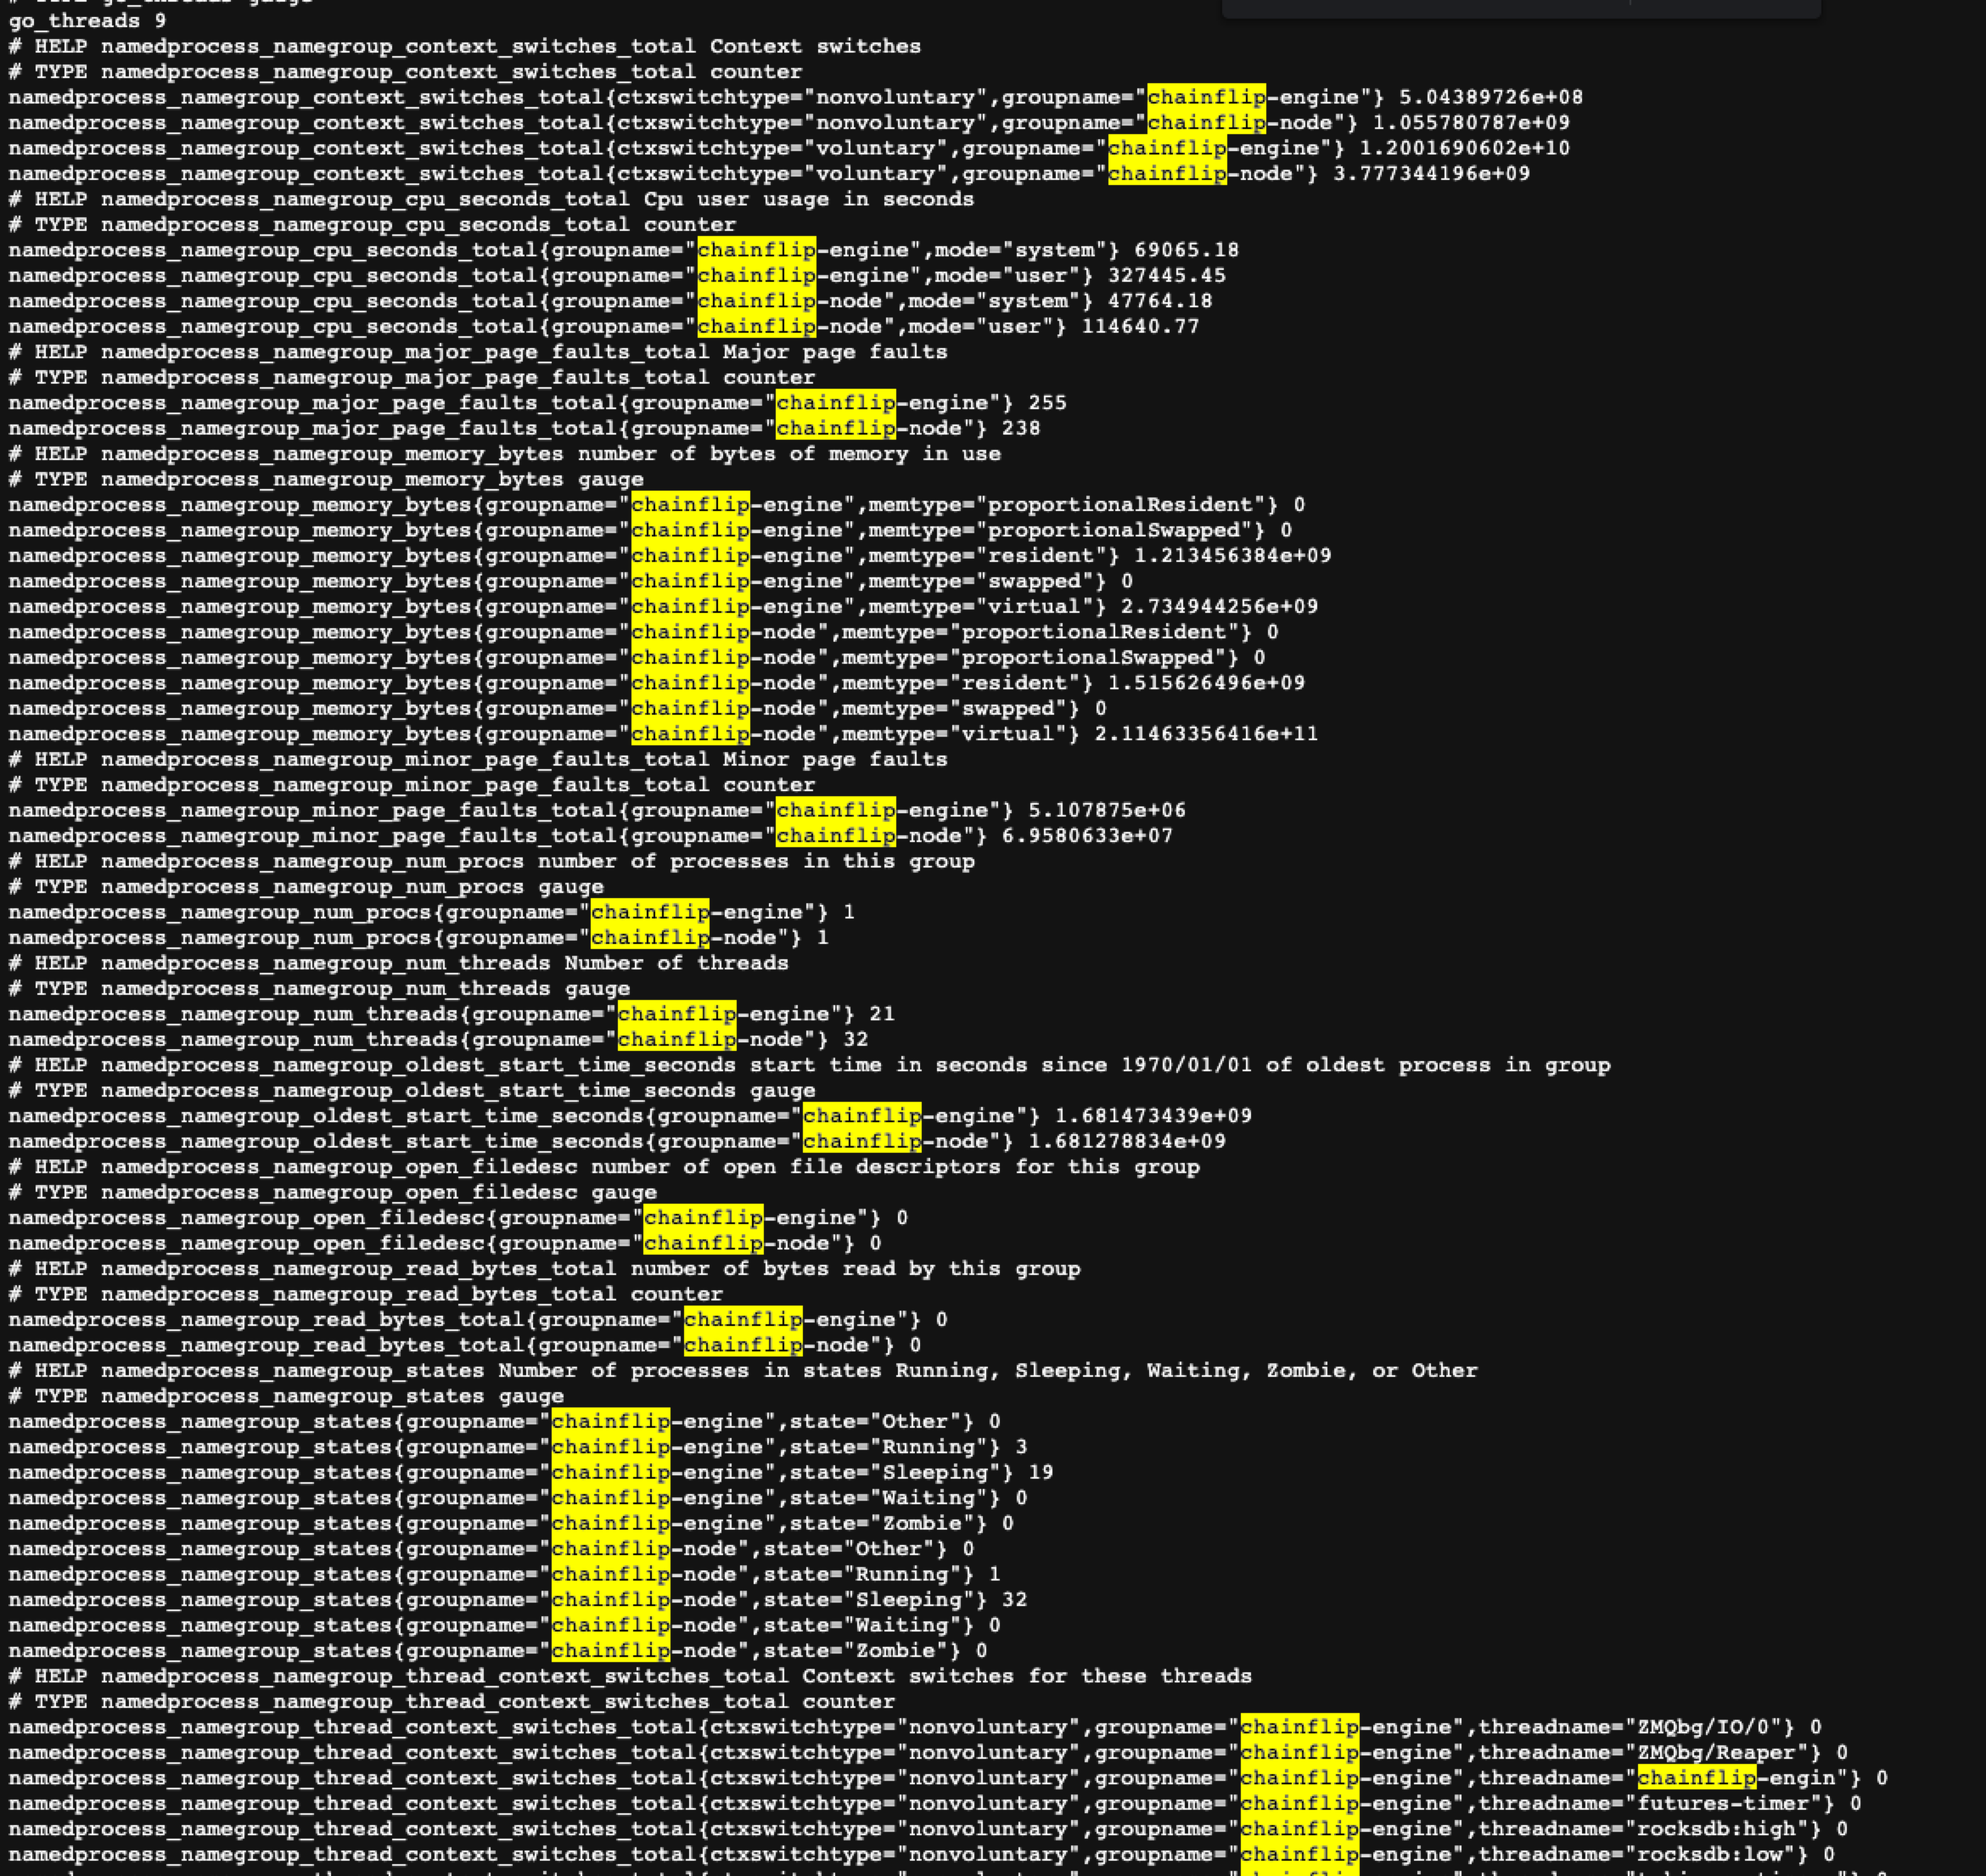
http://<your_node_public_ip_address>:9615/metricsYou should see the raw metrics that chainflip-node exposes:
.png)
If you aren't able to access the metrics, double check your firewall settings
and make sure port 9615 is exposed and publicly accessible.
Congratulations! You are successfully collecting metrics. 😎🎉
Update your promtail Config
If you haven't set up promtail yet, check the docs to do so
here.
In order to make it easier to connect the logs from your node to the metrics outlined in this tutorial, you need to add an extra label to the configuration file of your node under /opt/promtail/chainflip-promtail.yaml.
sudo nano /opt/promtail/chainflip-promtail.yamlThen add a new label:
host: "your_node_public_ip_address"
Your config looks something like this:
.png)
Save your changes and restart promtail:
sudo systemctl restart promtail.service
sudo systemctl status promtail.service
Expose Prometheus metrics for chainflip-engine
The chainflip-engine integrates prometheus natively to expose metrics.
To make those metrics available you will have to modify the engine config which can be modified with the following command:
sudo nano /etc/chainflip/config/Settings.tomland add the following settings:
[prometheus]
hostname = "0.0.0.0"
port = 5566
You need to restart the engine to apply the changes!. Be sure to scrape the metrics if you enable them, otherwise the engine will run out of memory over time.
Make sure your firewall exposes port 5566 publicly if you want to make this metrics available for Chainflip.
Check whether Metrics are accessible
You can also verify that your node is exposing metrics by navigating to in a web browser:
http://<your_node_public_ip_address>:5566/metricsSome useful metrics that are exposed:
Metrics are presented by their name and the labels they use.
- unauthorized_ceremony ["chain", "type"]: the number of unauthorized ceremonies an engine has active, all ceremonies should transition to an authorized state when the request is received from the state chain. If we start seeing this metric increasing it could mean that a validator is being spammed with fake ceremonies from a malicious actor, or that his node has lost connection with the other peers and hence it is not able to receive updates about the state of the network
- p2p_active_connections: counts the number of active peer connections, this should be at least equal to the number of validators in the authority set, otherwise it means that we are not connected with some of them which is required in order to complete the ceremonies.
- p2p_msg_received: count all the messages received by the engine, if this metric doesn't grow over time (when the network is fully operational and ceremonies are more common than once every few days) it is likely a problem regarding the configuration of the system, check the config file and be sure that the port stated there is reachable and open.
[node_p2p]
node_key_file = "/etc/chainflip/keys/node_key_file"
ip_address = "IP_ADDRESS_OF_YOUR_NODE"
port = "8078"- rpc_requests ["client", "rpc_method"]: The number of “planned” rpc request the engine is making, without keeping into account the number of retries. Using this in combination with
rpc_requests_totalcan help detect a malfunction of one or more RPC endpoints. - rpc_requests_total ["client","rpc_method"]: The number of total rpc request the engine is making, it keeps into account the number of retries as well. This metric should be used with
rpc_requeststo calculate a ratio (I.E.(rate(sum by(client) (rpc_requests) [5m:])) / (rate(sum by(client) (rpc_requests_total) [5m:])) * 100calculates the successful % of request made in the last 5m for every client) if this ratio starts dropping it means that there is a problem with the specified client (which directly point to an endpoint). The rpc clients are used to perform http requests while the subscribe ones are used to open a websocket connection. The clients can be: btc_rpc, dot_rpc, dot_subscribe, eth_rpc, eth_subscribe.
Summary
Let's recap what we've done.
- Installed and configured Prometheus Node Exporter
- Installed and configured Prometheus Process Exporter
- Updated your
chainflip-nodesystemd file to expose substrate prometheus metrics - Updated your
chainflip-engineconfig file to expose engine prometheus metrics - Opened Ports
9100,9256and9615 - Updated your
promtailconfig to add a new label